By Jasmine Payne, John R. Lewis Social Justice Fellow
Introduction
Although the federal minimum wage sets the wage floor for the country, there are special provisions that permit states to choose their own minimum wage. Historically, state policymakers have used this power to set minimum wages below the $7.25 per hour federal level. Today, two states permit wages 29% lower than the federal level and five states have no set minimum wage. A close examination reveals a correlation between states with low or no minimum wages and states highly populated by Black people and/or formerly slave states.[1] Consequently, state minimum wages affect Black wealth and increase the racial wealth gap—the gap in accrued wealth between Black Americans and white Americans. Does the influence of American slavery still impact wages today? This report explores the history of low and no minimum wage states and explains the overlap of race with economic data to assess the impact on the Black community.
State Minimum Wages
According to the U.S. Department of Labor, “Federal minimum wage law supersedes state minimum wage laws where the federal minimum wage is greater than the state minimum wage. In those states where the state minimum wage is greater than the federal minimum wage, the state minimum wage prevails” (Department of Labor, n.d.). The federal minimum wage is set to ensure that there is a national wage floor to provide uniformity in the minimum across the nation. States, however, are permitted to choose their own minimum wages to permit flexibility based on varying costs of living, with the highest in Hawaii and the lowest in Mississippi (Bureau of Labor Statistics, n.d.). In theory, states with lower costs of living would have minimum wages that reflect state expenses and have greater opportunity for increases. Currently, there are 30 states, the District of Columbia, Guam and the Virgin Islands that have minimum wages above the federal level ranging from $8.75 to $15.20 per hour (Department of Labor, 2022).
Everyone and every company, however, is not covered by the Federal Labor Standards Act (FLSA) which permits states to choose their minimum wages. The FLSA applies to the following groups:
- Employees of enterprises that have annual gross volume of sales or business done of at least $500,000
- Employees of smaller firms if the employees are engaged in interstate commerce or in the production of goods for commerce. These include employees who work in transportation, communications or who regularly use the mails or telephones for interstate communications, guards, janitors, and maintenance employees who perform duties which are closely related and directly essential to such interstate activities
- Employees of federal, state or local government agencies, hospitals and schools, and it generally applies to domestic workers (Department of Labor, n.d.).
The federal minimum wage applies to states with low or no minimum wage mandating that businesses pay their employees $7.25 unless they do not meet the standards above. When they do not achieve these standards, the state minimum wage prevails. When a state’s minimum wage is higher, it also supersedes the federal level (Department of Labor, 2022). Based on the permissions the FLSA gives to states, Georgia and Wyoming have minimum wages below the federal level at $5.15. Also, five states: Alabama, Louisiana, Mississippi, South Carolina and Tennessee, do not have state minimum wages.
In addition to businesses and people who are covered and not covered, the FLSA also identifies exempt and non-exempt groups. Lawmakers added exemption language to the FLSA between 1977 and 1978. (Department of Labor, n.d.). Exempt workers such as certain technology, farm and other workers do not have to abide by the same federal wage requirements. Most workers, however, are considered non-exempt and therefore receive protection from the FLSA. Over time, lawmakers have amended the FLSA due to lobbying from businesses and nuances in various industries. Some sections also unfairly adjust for the type of output that businesses believe can be expected of workers based on factors such as age and if they are a person with a disability (Fair Labor Standards Act, 1938). For example, it is still legal for employers to discriminate against employees by paying people who have disabilities lower wages.
Enforcement of the Federal Minimum Wage
The FLSA also established The Wage and Hour Division of the Department of Labor. The Wage and Hour Division enforces labor laws in private, state and local employment. This department is responsible for ensuring that people are complying with the minimum wage laws (Department of Labor, n.d.). The work of this department helps workers earning low wages through the data and rules they enforce making it an essential participant in minimum wage discussions and policy reform.
History of the Federal Minimum Wage and the Federal Standards of Labor Act of 1938
On June 25, 1938, President Franklin Delano Roosevelt signed the Fair Standards of Labor Act of 1938 which established the minimum wage of 25 cents per hour effective October 24, 1938 (Department of Labor, n.d.). The Act was a New Deal Era initiative, intended to provide post- Great Depression policies to help workers and to boost the economy. The concept of a minimum wage has been a point of contention even before its codification into law. In a fireside chat discussing the Bill, President Roosevelt said, “Do not let any calamity-howling executive with an income of $1,000 a day, …tell you…that a wage of $11 a week is going to have a disastrous effect on all American industry” (Roosevelt, 1937).
Decades later, the revised Fair Labor Standards Act, effective July 24, 2009, increased the minimum wage to $7.25 (Department of Labor, n.d.). There have been no increases since then.
The table and chart below show the changes in minimum wage over time.
Historical Changes in the Minimum Wage
| Year Effective | Years between increase | Minimum Wage (in dollars) | Percent Change |
| 1938 | 0.25 | ||
| 1939 | 1 | 0.3 | 20% |
| 1945 | 6 | 0.4 | 33% |
| 1950 | 5 | 0.75 | 88% |
| 1956 | 6 | 1 | 33% |
| 1961 | 5 | 1.15 | 15% |
| 1963 | 2 | 1.25 | 9% |
| 1967 | 4 | 1.4 | 12% |
| 1968 | 1 | 1.6 | 14% |
| 1974 | 6 | 2 | 25% |
| 1975 | 1 | 2.1 | 5% |
| 1976 | 1 | 2.3 | 10% |
| 1978 | 2 | 2.65 | 15% |
| 1979 | 1 | 2.9 | 9% |
| 1980 | 1 | 3.1 | 7% |
| 1981 | 1 | 3.35 | 8% |
| 1990 | 9 | 3.8 | 13% |
| 1991 | 1 | 4.25 | 12% |
| 1996 | 5 | 4.75 | 12% |
| 1997 | 1 | 5.15 | 8% |
| 2007 | 10 | 5.85 | 14% |
| 2008 | 1 | 6.55 | 12% |
| 2009 | 1 | 7.25 | 11% |
Source: United States Department of Labor, https://www.dol.gov/agencies/whd/minimum-wage/history/chart
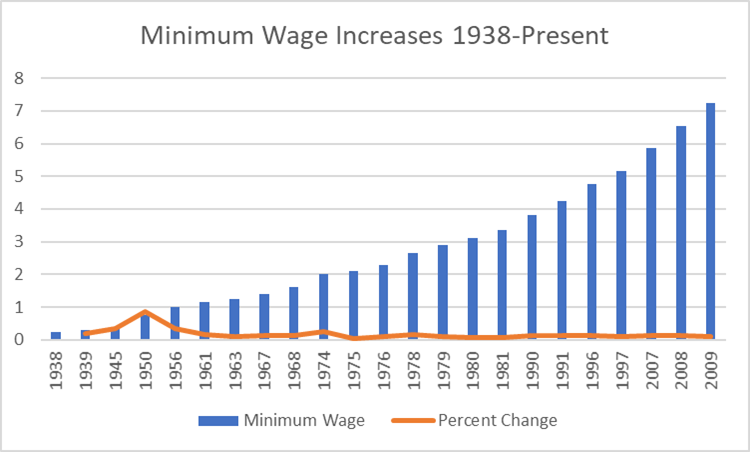
Source: United States Department of Labor, https://www.dol.gov/agencies/whd/minimum-wage/history/chart
Approximately every three years the minimum wage increases an average of 17 percent. The last increase was thirteen years ago in 2009. If legislation were to follow historical trends, an adjustment to the federal minimum wage is ten years behind and should have changed at least three times, demonstrating the longest period without an increase in the federal minimum wage. Though federal minimum wage increases are stagnant, state minimum wages can change even more slowly. States that have not adopted a minimum wage have a 0% rate of change and the state of Georgia has a varied rate of change with its last increase in 2002- twenty years ago. Further, unlike most other states, it has actually decreased in the past (Department of Labor,n.d.).
History of State Minimum Wage
Historically, some states increased their minimum wages as inflation rose. Changes in one state due to increased trade, discovery of natural resources or changes in population had variable wage growth. To adjust for the cost of living, the FLSA permitted states to choose their own minimums. Currently, 17 states and the District of Columbia have scheduled increases (Department of Labor, 2022). These increases are indexed to match inflation.
The minimum wage in Georgia and Wyoming remains the same as the 1997 federal level minimum wage. States with no minimums (Alabama, Mississippi, Louisiana, Tennessee, and South Carolina) may have wages as low as $0.01 per hour; therefore, they arguably have minimum wages as old as the Fair Labor Standards Act of 1938 when the concept of minimum wages was first codified into law.
The changes in state minimum wages are dependent on the state legislature’s propensity for change. A National Conference of State Legislatures state minimum wage summary highlights the changes in minimum wage by state since 2016. The research shows no explicit pattern of change (National Conference of State Legislatures, 2022). Still, trends derived from the changes and overlapping local events expose that lawmakers change the minimum for the state when the political environment lends itself to change based on cost-of-living increases and support from the coalition groups. Critical to these factors is the political will of the state. Opponents of minimum wage increase argue that increased minimums will harm businesses, lead to layoffs and hinder job growth due to increased production costs (Brittanica, 2019). A House Committee on Education and Labor (formerly the Committee on Education and the Workforce) found data that businesses would instead benefit, reduce turnover and boost the economy (House Committee on Education and Labor, 2010).
Purchasing Power
The federal minimum wage has increased over time in nominal dollars, but it has not always increased to adjust to inflation. According to the Economic Policy Institute, if Congress continued to raise the wage over the years, the federal minimum wage would currently be over $22 per hour. In fact, the value of the minimum wage is worth 34% less today than in 1968. For example, $7.25 today was worth $10.59 in 1968. This illustration highlights how the minimum wage has declined 21% in value since its last increase in 2009, meaning that a worker earning the minimum wage earned more in 2009 than they would today (Zipperer, 2021). Still, even when adjusting for inflation, the value of the minimum wage has not been as low as the federal level since 1945 and not as low as Georgia and Wyoming’s minimum wage since it began in 1938 (Department of Labor, n.d.). The table below uses United States Bureau of Labor Statistics and Department of Labor data to demonstrate the change over time compared to today’s dollars.
Changes in the Value of Minimum Wage Over Time
| Year Effective | Minimum Wage (In dollars) | Value in Today’s Dollars (In Dollars) |
| 1938 | 0.25 | 5.00 |
| 1939 | 0.30 | 6.08 |
| 1945 | 0.40 | 6.38 |
| 1950 | 0.75 | 9.05 |
| 1956 | 1.00 | 10.59 |
| 1961 | 1.15 | 10.95 |
| 1963 | 1.25 | 11.67 |
| 1967 | 1.40 | 12.07 |
| 1968 | 1.60 | 13.31 |
| 1974 | 2.00 | 12.18 |
| 1975 | 2.10 | 11.44 |
| 1976 | 2.30 | 11.74 |
| 1978 | 2.65 | 12.03 |
| 1979 | 2.90 | 12.05 |
| 1980 | 3.10 | 11.30 |
| 1981 | 3.35 | 10.92 |
| 1990 | 3.80 | 8.46 |
| 1991 | 4.25 | 8.96 |
| 1996 | 4.75 | 8.73 |
| 1997 | 5.15 | 9.18 |
| 2007 | 5.85 | 8.20 |
| 2008 | 6.55 | 8.80 |
| 2009 | 7.25 | 9.74 |
Source: United States Department of Labor, https://www.dol.gov/agencies/whd/minimum-wage/history/chart, Bureau of Labor Statistics, https://data.bls.gov/cgi-bin/cpicalc.pl?cost1=7.25&year1=200901&year2=202202
States have various costs of living even within their state lines leading lawmakers to seek to combat low wages. Consequently, localities and municipalities often seek to enact their own minimum wages due to the low or no minimum state wage. Of the 21 states in which the federal minimum wage applies because the state minimum is lower, only one state- Wyoming prohibits city and county governments from adopting higher minimum wages (Desilver, 2021).
Slave, Great Migration and Minimum Wage States
American low wages are directly tied to slavery and indentured servitude. At the genesis of wage pay in America, labor costs approximately three times that of labor in England. Labor grew so expensive that colonials created laws on maximum pay as opposed to the minimum. In 1630, lawmakers set the maximum daily rate equal to $2.43 per day (in 1929 dollars). Shortages in labor from laws only permitting “freemen” and “property holders” prevented laborers from joining the towns. Scarcity of labor and high labor costs led people to search for workforce replacements. Eventually, colonials turned to slavery and indentured systems for free and inexpensive labor introducing the history of low American wages (Bureau of Labor Statistics, 1929).
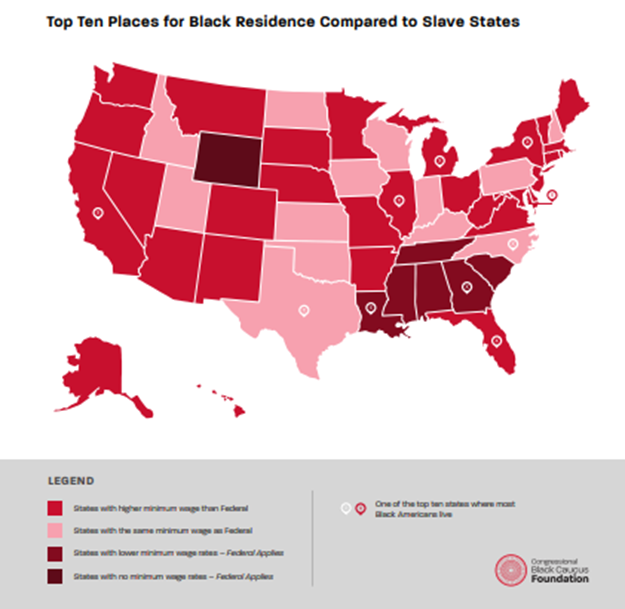
Low minimum wages remain a hindrance with major impacts on Black people through the ancestry of slave labor and exploitation. According to the United States Census, the ten states most populated by Black Americans (comprised of 60% of the Black population) are: Georgia, Florida, Louisiana, North Carolina, New York, California, Illinois, Texas, Maryland and Michigan (Census, 2016). Comparatively the largest states for slave labor by 1850 were Alabama, Georgia, Louisiana, Kentucky, Maryland, Mississippi, North Carolina, South Carolina, Tennessee and Virginia (Census Bureau, n.d.).
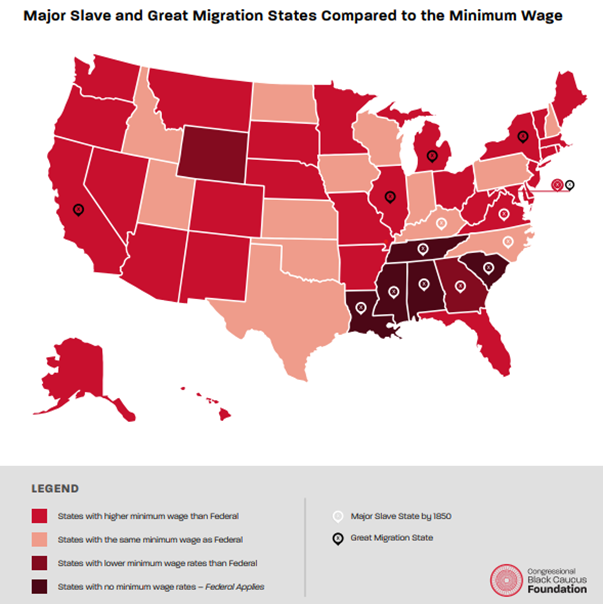
A strong correlation exists between states that had high slave labor and low minimum wage. A Pew Research study found that more than half (56%) of all Black people in the United States live in the South—the region where most states with low or no minimum wage are located (Tamir, 2021). Every state that has no minimum wage was a former slave state. Further, 50% of the states that have minimum wages below the federal minimum are former slave states. Former slave states Georgia, Tennessee, Alabama, Louisiana, Mississippi and South Carolina, 60% of slave states, have state minimum wages below the federal minimum wage or no minimum wage at all. Kentucky and North Carolina have minimum wages equal to the federal minimum. Only two former slave states, Virginia ($11/ per hour) and Maryland ($12.50/ per hour), have state minimum wages higher than the federal minimum.
| Slave States with wages with no minimum wage | Slave States with wages below the minimum wage | Slave States with wages above the minimum wage |
| Tennessee Alabama Louisiana Mississippi South Carolina | Georgia | Virginia Maryland |
Former slave states are among the lowest-paying in the country. In 2021, 80% of former slave states had median family incomes below the $79,990 per year national level. Slave states comprised six of the ten lowest median incomes with Mississippi as the lowest (United States Department of Housing and Urban Development, 2021). Some of the other states included in the lowest median family incomes have high immigration rates (New Mexico) – groups that are also susceptible to low pay, home to many indigenous people who were also enslaved (New Mexico and Oklahoma) or were formerly part of slave states (West Virginia).
States with the Minimum Median Family Income and Slave States
| State | Median Family incomes |
| Alabama | $66,700 |
| Arkansas | $60,700 |
| Georgia | $74,700 |
| Idaho | $69,000 |
| Kentucky | $65,100 |
| Louisiana | $64,700 |
| Maryland | $106,000 |
| Mississippi | $60,000 |
| New Mexico | $61,400 |
| North Carolina | $70,900 |
| Oklahoma | $67,000 |
| South Carolina | $68,700 |
| Tennessee | $68,600 |
| Virginia | $93,000 |
| West Virginia | $60,300 |
Source: United States Department of Housing and Urban Development, 2021
The historical background of state economies help to explain the pay variations in former slave states. More than half of American states had enslaved populations, but not all states had economies dependent on slave labor. Other states that utilized slave labor had less than 100,000 enslaved Africans by the 1850’s (National Archives, n.d.). Northern New England colonies enslaved Africans, but typically had economies focused on specialized skills and household needs instead of agriculture. Consequently, northern states typically had less desire for slave labor (National Geographic, 2020). Maryland is a key example of differing labor demand as its northern region differed from the southern region which was more focused on agriculture. The slave population in Maryland decreased starting in the 1830’s as soil exhaustion and other factors led to falling tobacco sales. Free Black residents also lived beside enslaved Africans causing tension and greater opportunity to escape. In contrast, the demand for cotton soared in the south increasing the desire for slave labor. Maryland residents sold approximately 20,000 enslaved Africans to southern cotton farmers as the slave industry began to falter in the state from 1830-1860 (Maryland State Archives, n.d). The transition of economic dependence in Maryland demonstrates the contrast in wage laws as Maryland transitioned before the Emancipation Proclamation and has wages above the federal minimum at $12.50/ hour (Department of Labor, 2022). The presence of enslaved Africans in the states with lower slave populations further emphasizes the importance of slavery in states dependent on free labor; because free labor was so embedded in their economies, slave states became reliant on exploited labor—a trend that continues today. The diagram below shows Census data of the slave population in the United States from 1790 to 1850.
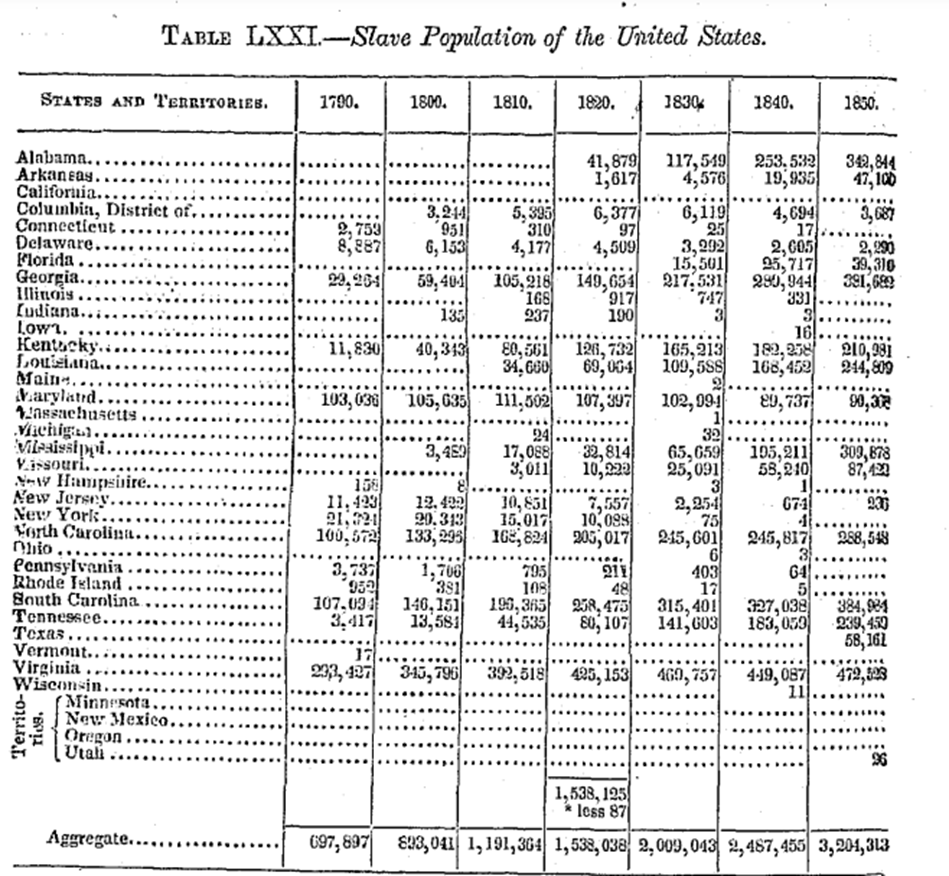
(United States Census Bureau, n.d.) https://www2.census.gov/library/publications/decennial/1850/1850c/1850c-04.pdf
Though the Emancipation Proclamation was signed in 1863, available Census data for the Slave Population of the United States ended in 1850. (National Archives, 2022). The map below shows the 1860 slave population of the U.S. southern states.
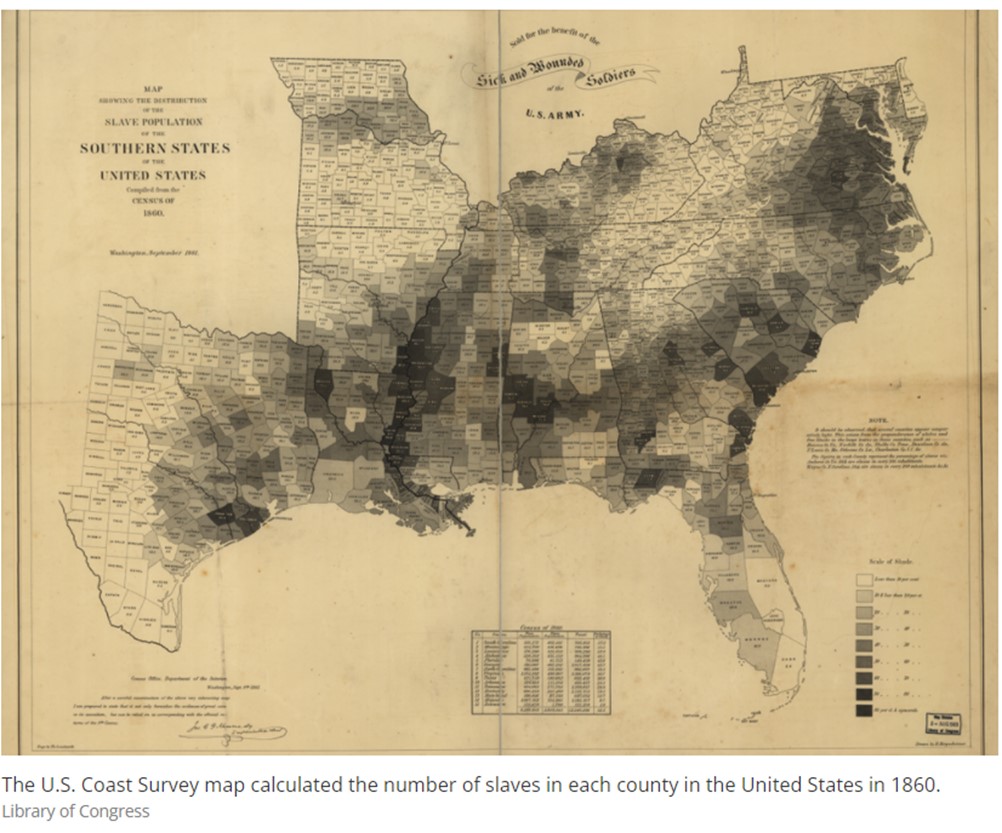
Source: Library of Congress, 2014 https://www.smithsonianmag.com/history/maps-reveal-slavery-expanded-across-united-states-180951452/
Sources: United States Census Bureau and the National Archives
The diagrams above illustrate how most states with high percentages of Black people were either Great Migration states or states known with robust slave labor by 1850. States listed above that were not known as major slave states, still had enslaved people and were Great Migration[2] states: states where formerly enslaved Africans moved once slavery was abolished. This migration occurred in multiple waves from 1910-1970. These states include Illinois, Michigan, New York, and California (National Archives, n.d.). A National Bureau of Economic Research study found that the Great Migration states paid higher wages when compared to slave states helping Black workers close the racial wealth gap (Collins, 2021). Among the top ten states where Black people live, four are Great Migration states.[3]
States with low minimum wages remain key locations for Black families to live. California, New York, Illinois and Maryland are the outliers with higher minimum wages. The difference in pay in these Great Migration states demonstrates the divide between the former slave states and states that historically had less slave affiliation. Of the states with large Black populations, only two of sixteen states (12.5%)— Texas and Florida—were neither major slave states nor Great Migration states.
What is at Stake Now?
Low wages impact economic status and mobility, especially for Black families. In 2020, 865,000 workers make below the minimum wage and 247,000 earn the minimum wage (Bureau of Labor Statistics, 2021). Among white workers,178,000 made the minimum wage and 631,000 made below the minimum wage. Compared to the total amount of white hourly workers that number equates to .3% and 1.1%. Among Black workers, 50,000 made the minimum wage and 146,000 made below the minimum wage. There are .5% of Black workers earning the minimum wage and 1.4% earning below the minimum wage. Over 50% of people who make below the minimum wage live in the South, which overlaps with the locations where most Black workers live and statistically would make it likelier for Black workers to earn the minimum wage. Additionally, though several Great Migration states have higher minimum wages, New York, Michigan and California are also among the states that comprise the highest percentage of workers making below the minimum wage. New York and California have large immigrant populations with Black and Brown people which likely contributes to the low wages. (Bureau of Labor Statistics, 2021).
Though the percentage of workers who earn the minimum wage or below the minimum wage are statistically small, the presence of a low wage floor drives down overall state wages. Economic principles present a supply and demand analysis where to maximize profits, businesses work to reduce their operating costs. A huge factor is paying their employees to produce outputs. If the wage floor is low, vulnerable people choose the jobs that are available which are often the lowest paying. With low wages, even the federal minimum wage appears competitive compared to the state minimum wage and drives people to lower-paying jobs; when there is greater availability of minimum wage jobs, people work those jobs which are less competitive than higher-paying jobs. Consequently, the impact of a minimum wage increase can have substantial effects not only for minimum wage workers but also workers earning slightly above the minimum. Researchers from the Quarterly Journal of Economics found statistically significant, wage spillovers, the wage increase for people previously earning wages at or below the minimum to maintain the hierarchy in wages. Wage spillovers extend up to $3 above the minimum wage and account for 40% of wage increases in a company (Cengiz, 2019).
Another challenge that low wages present is greater susceptibility to job loss. Newly hired workers considered low-skilled who often earn hourly wages were more likely to be Black regardless of age and skill training (Acs, 2009). This gap is due partially to the difficulty of Black workers moving to areas with better-paying jobs and the challenge to find a job after one job ends (Weller, 2019). In the context of the global COVID-19 pandemic, the Economic Policy Institute found that low-wage workers were more likely to lose their job with 27% of ‘low-wage’ workers experiencing job loss compared to 8.8% of the highest-paid workers (Gould, 2021). This too has racial impacts. The unemployment rate for Black workers jumped to almost 17% compared to 14% for white workers at the height of the pandemic (Gould, 2020).
Impact of Minimum Wage on the Black Community
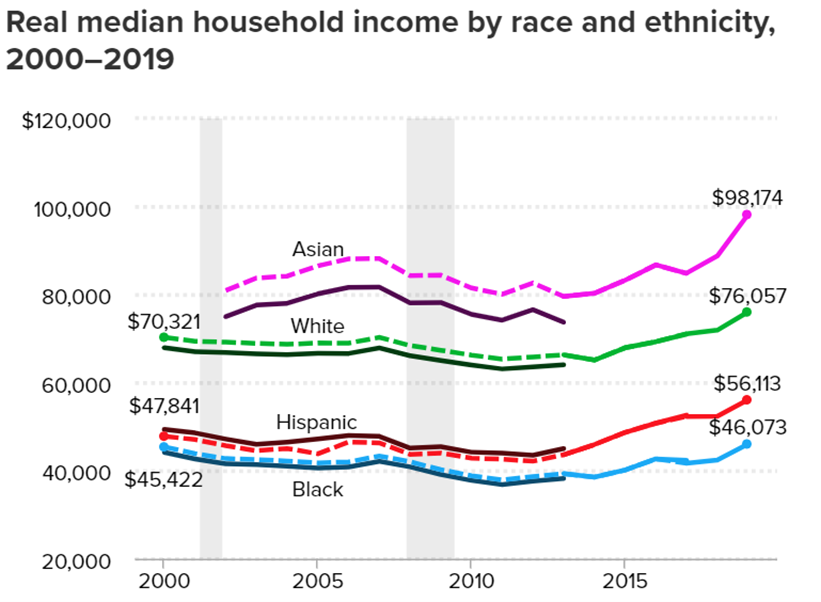
The minimum wage has an enormous effect on the country, especially on the Black community with the overlap between states with low minimum wages and states with high concentrations of Black Americans. Low state minimum wages drive down the overall state pay, which further affects the national Black median wage. Lower wages for Black households compared to the incomes of white households shows this impact. According to Pew Research, before 2019, 29% — almost one in three— of Black households earned less than $25,000 per year. More than half (54%) of Black households made less than $50,000 per year (Tamir, 2021). In comparison, white households earned $72,204 per year (Census Bureau, 2019). In 2019, the median Black household earned 61 cents for every dollar of income that the median white household earned. The chart below shows this income distribution (Wilson, 2020).
Source: Economic Policy Institute, 2020 https://www.epi.org/blog/racial-disparities-in-income-and-poverty-remain-largely-unchanged-amid-strong-income-growth-in-2019/
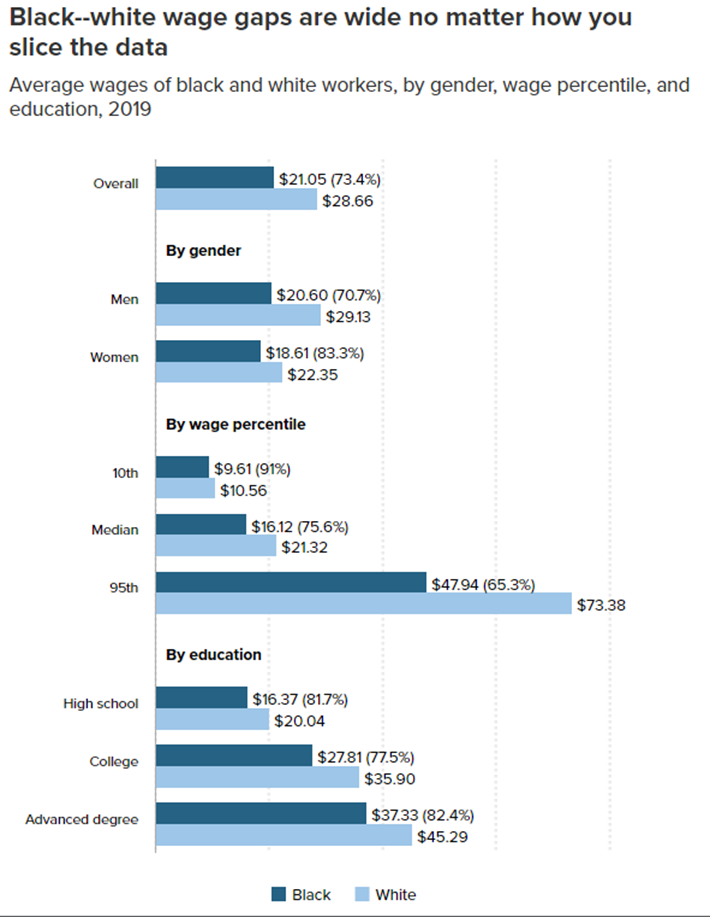
Lower minimum wages and subsequent low state wages, continue to contribute to the gaps in pay between white and Black workers. According to the Economic Policy Institute, the minimum wage in 1968 was worth $11.12 in today’s dollars and narrowed the racial wealth gap (Zipperer, 2021). Black workers are more likely to earn the minimum wage because of job discrimination which excludes Black workers and education systems that disrupt further degree attainment. Bureau of Labor Statistics data from 2021 reports that the median household income for a white person working full-time without a college degree is $43,732 and $76,336 for those with a college degree or higher (Bureau of Labor Statistics, 2021). Comparatively, Black people without a college degree earn $36,816 and $68,692 with a degree. The 2019 Economic Policy Institute study also found that regardless of the group (education, gender, etc.), white workers earn more than Black workers (Gould, 2020).
Source: Economic Policy Institute, https://www.epi.org/publication/black-workers-covid/
Low Wages for White Americans Compared to Black Americans
Housing
A substantial factor of wealth is homeownership. Despite low minimum wages white people have benefited from land grant programs and housing programs that permit them to acquire land and increase their wealth. Simultaneously, Black Americans were excluded from such programs, notwithstanding their ability to afford the housing. The history of redlining, low home value assessments, and eminent domain laws that forced Black homeowners out of their property have persisting impacts (Ray, 2021). The Black homeownership rate in 2021 was 46.4% compared to 75.8% for white families (U.S. Census Bureau, 2021).
Wealth
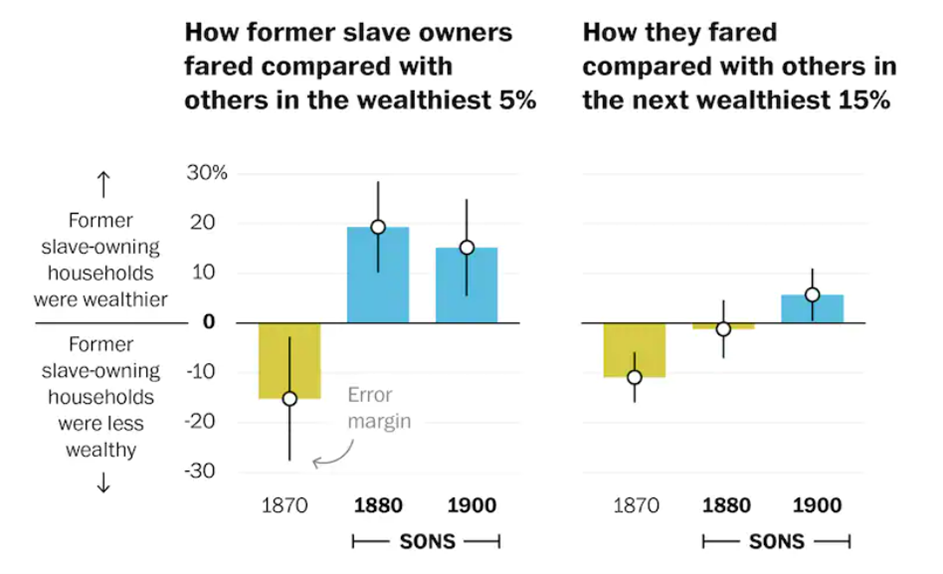
People of all races live in states with low or no minimum wages, but low wages affect various racial groups differently. According to the Board of Governors of the Federal Reserve System, white people have eight times the wealth of Black families (Bhutta, 2020). Because white wealth is higher, the impact of lower-wage jobs disproportionately affects Black communities. Many white Americans, especially in the American South, were privileged to start their lives with some degree of wealth due to resource inheritance. White southerners assigned a cumulative “value” of almost $4 billion dollars to the enslaved Africans by 1860 and received financial benefits far greater through their labor (Economic History Association, n.d.). Though money from slave labor may have dissipated, residual wealth and influence from the 1600-1800s slave era remains today. National Bureau of Economic Research authors believed that offspring who owned enslaved Africans were able to maintain their wealth levels long-term in part because of the strong social networks and marital arrangements (Ager, 2019).
For some descendants of people who enslaved Africans, the inheritance trickles down today and continues to cushion the acquired wealth of white households. A National Bureau of Labor Statistics report showed that sons of former slave owners fared better after the Civil War than non-slave owners.
Source: National Bureau of Labor Statistics and Washington Post https://www.washingtonpost.com/us-policy/2019/04/04/how-souths-slave-owning-dynasties-regained-their-wealth-after-civil-war/
In addition to the liquid assets, white families also maintained land promised to Black families as reparations. In 1865 the concept of “40 acres and a mule” originated after General William T. Sherman issued Special Field Order No.15 which confiscated confederate land from South Carolina to Florida and redistributed it to newly freed Black families. He also ordered the army to loan Black families mules. President Lincoln sent a representative to negotiate these terms with Black leaders and established the Freedman’s Bureau to give title to the land. Unionists intended for the decree to solve multiple problems: punishing American southerners who owned slaves and drove need for more slave labor and found a place for the newly freed population to build their homes and economies: “the new class of free Southern laborers.” When Andrew Johnson became president, after President Lincoln’s assassination, he reversed the order returning the land to slave owners that fall. (Myers, 2020). There are many estimates for the present value of “40 acres and a mule” per freed family with some calculating the accumulated value to $640 billion (Packman, 2020).
Not all white Americans have these benefits, however, the amount of wealth among white Americans versus Black shows the impact of the presence of these benefits.
Whiteness as Privilege
Cheryl Harris, a Harvard University Law Professor, discusses how whiteness is used as the foundation of racialized privilege protected by law (Harris, 1993). Historically, there have been a medley of ways that white people may use their whiteness as collateral to advance socially and economically. These intergenerational impacts bleed into disparities today. White privilege has meant greater affordability of goods as white people utilize power and access to bring suppliers to their neighborhoods, in contrast, Black community members were excluded because of systemically racist practices like Black Codes. This also means that access to premier products instead of secondhand products that would need replacement such as newly minted goods. In education this meant free quality education with government-sponsored resources as opposed to the used textbooks and limitedly funded equipment given to Black schools. In terms of goods, whiteness unlocks the ability to enjoy low-cost goods uninterrupted by stealing and torment or competition for goods sold that may have led to lynching. Today, the privilege bestowed through whiteness means fewer barriers for white voters which supports candidates who vote in your economic interest (Morris, 2021). It also manifests as white neighborhoods having greater access to grocery stores with more affordable pricing and healthier goods amidst food apartheid[4]; greater access to nutritious food also leads to greater health outcomes decreasing the chances of expensive and deadly illnesses (Reinhardt, 2019). Lastly, prospective workers with white names are 50% more likely to receive employment responses than people with Black names making it more likely to hire white workers (Kline, 2021).
Insufficient Wages for the Cost of Living
Minimum wages provide insufficient wages for the cost of living making it difficult for many to afford necessities such as housing, food and other essential goods. Many who work minimum wage jobs have difficulty finding full-time work, still even full-time workers earning the minimum wage would still struggle to afford basic necessities such as housing. According to the Economic Policy Institute, “As of 2021, in virtually all urban and rural areas of the country, a single adult without children working full time must earn more than $15 per hour to have enough to pay for housing and other basic living expenses. For individuals with children, year-round work at a $15 wage in 2025 will still be inadequate to achieve basic economic security” (Economic Policy Institute, 2021). The National Low-Income Coalition finds that a Georgia household would need to work full-time earning $19.42 per hour ($40,398 per year) to afford a modest two-bedroom apartment. That is the equivalent of working 107 hours per week on the federal minimum wage and 151 hours on Georgia’s minimum wage to afford housing[5] Households in Alabama, Louisiana, Mississippi, Tennessee and North Carolina—states with no minimum wage—would need to work full-time earning $15.80 per hour ($32,864 per year), 87 hours on the minimum wage and an unknown number of hours based on state minimum wage laws as they do not have a stated minimum. The chart below shows the number of hours each worker would need to perform to afford modest housing in their state.
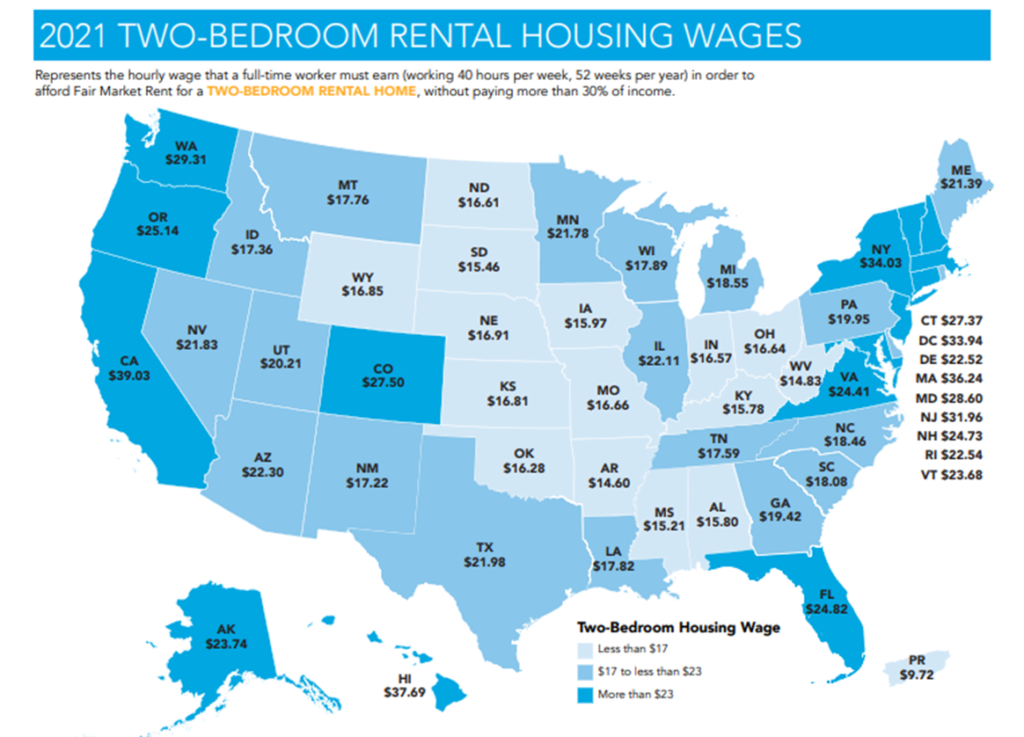
Source: National Low Income Housing Coalition, https://nlihc.org/sites/default/files/oor/2021/Out-of-Reach_2021.pdf
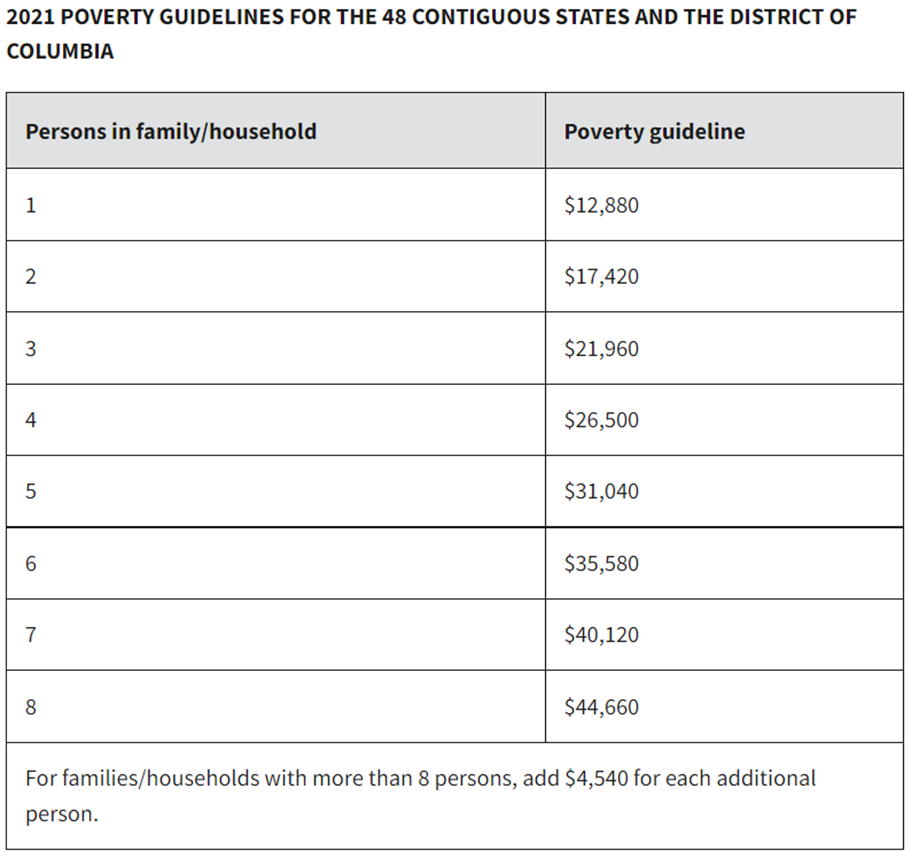
Not only are low wage workers financially vulnerable due to decreased access to basic needs, but a significant amount of people earning the state and federal minimum wage are in poverty. The United States Department of Health and Human Services sets yearly poverty guidelines to determine eligibility for social services. Using their metrics, the poverty level in 2021 for:
- a one-person household is $12,880 per year,
- a two-person household is $17,420 per year and
- a three-person household is $21,960 per year (US Health and Human Services, 2021).
A person earning the federal minimum wage working full-time would earn $15,080 per year, $10,712 on Georgia or Wyoming’s minimum and an incalculable amount based on states with no minimums. Georgia and Wyoming state minimum wage workers would be below the poverty level regardless of their household size and workers earning the federal minimum wage would be below the poverty level if they had another person in their household not working.
Source: Department of Health and Human Services, https://aspe.hhs.gov/topics/poverty-economic-mobility/poverty-guidelines/prior-hhs-poverty-guidelines-federal-register-references/2021-poverty-guidelines
Similarly, the Census Bureau creates poverty thresholds to determine the amount of people in poverty each year and to generate statistical data. Based on the metrics set by the poverty thresholds, the following eligibility would apply:
- A one-person household would meet the threshold at $14,097 per year
- A two-person household with one child would meet the threshold at $18,677 per year
- A three-person household with two children would meet the threshold at $21,831 per year (Census Bureau, 2021).
Based on these levels, a worker in Georgia or Wyoming making the state minimum wage would be below the poverty level. Someone earning the federal minimum wage would be $1,000 away from the poverty level and below it once they had one child or additional household member. Workers earning below the federal minimum wage in Alabama, Louisiana, Mississippi, Tennessee, and North Carolina would likely earn less and qualify at a lower household size.
Precarious Safety Net
Poverty guidelines determine eligibility for social service programs that would help fill the gap between income and living expenses, but these programs fall short of providing basic needs such as food, shelter and childcare. Programs such as the Supplemental Nutrition Assistance Program (“SNAP” also known as food stamps), Women, Infants and Children (“WIC”), housing and various other programs are determined by how much workers earn compared to the poverty guideline. Safety net programs vary in coverage based on a percentage for the poverty threshold such as 150%, 200%, etc. Low wage earners are highly susceptible to the wage cliff as they “earn” out of social services, but still have wages too low to meet basic needs. The calculations of how much a household would lose in benefits from earning more is highly mercurial. Still some studies show the difficult impact it has on various households. According to the Urban Institute, many families receiving Temporary Assistance for Needy Families (“TANF”) benefits would lose upwards of half of their $2,300 in benefits if they earned more. Based on their research it is better to obtain jobs that pay more wages consistently than to receive volatile benefits (Andersen, 2022). The Urban Institute also found that in 2020, even the maximum SNAP benefit did not cover the cost of a meal in 96% of counties in the United States (Waxman, 2021).
Impact on the Racial Wealth Gap and Socioeconomic Mobility
Low wages impact the ability to acquire wealth for present and future generations; therefore, increasing wages can help to close the racial wealth gap. Scholars find that raising the minimum wage would boost the wages of 31% of Black workers compared to about 20% of white workers (Cooper, 2021). Further, Black workers still make only 82.5 cents for each dollar a white worker earns and are 2.5 times as likely to be in poverty leading to white families having ten times as much wealth. These trends have persisted for decades- in 1968 the average Black family had $2,467 in wealth compared to the $17,509 in 2018. Over the same period, white family wealth tripled. In comparison, in 2016 Black families had 10.2 % of the wealth of the median white families which was $171,000 (Jones, 2018). Increased wages can also present the ability to secure housing. Instead of the Black homeownership rate (46%) being almost half that of the white homeownership rate (75%) with rates that have changed little since 1968 for Black homeowners, higher wages could help prospective homeowners secure down payments and build stronger credit scores for loan eligibility (Jones, 2018 and Census Bureau, 2021). In addition, higher pay could equip Black students with greater ability to obtain college degrees which produce higher lifetime incomes. Black workers with bachelor’s degrees can expect to earn 56% more over their lifetime than if they did not have a college degree (UNCF, n.d.). Expanding the federal law to regulate state minimum wage disrupts the connection between slave states and the minimum wage increasing pay equity and distancing Black Americans from the history of slavery and exploitative pay.
Policy Recommendations
- Expand FLSA coverage and eliminate exemptions that permit wages below the federal minimum wages.
To fully address the ability of states selecting their own minimum wages, federal lawmakers must pass legislation to eliminate exemptions and extend coverage for the Fair Standards and Labor Act. Deleting these exemptions and adding coverage would require that all workers be paid the federal minimum.
- Increase the federal minimum wage to $15 per hour.
Though an increase in the minimum wage does not automatically increase all state minimum wages, it does require most states to lift their wages as workers and businesses that are covered would have an increased wage. Additionally, covered and non-exempt workers in states that do not have minimum wages must comply with the federal minimum wage lifting their wages. Higher federal minimum wages also create competition with other jobs causing employers to need to raise their prices to attract workers applying for jobs with more competitive pay. Advocates for increased pay have agreed upon the goal of at least $15 per hour with increases likely based on the decreased buying power now compared to when the $15 amount was first introduced.
- Align the federal minimum wages with inflation.
Historically policymakers periodically increased the minimum wage to adjust to the cost of living. To prevent the dependency of increases on the political climate, policymakers should index both state and federal minimum wages to rise with inflation. A policy to automatically provide an increase would eliminate the need for political negotiation and streamline wages in line with the cost of living for workers.
- Mandate a study from the Department of Labor to track how many people are currently earning their state’s minimum wage and the federal minimum wage.
Though state and federal minimum wage data exists, researchers still have many questions about minimum wage workers. Among these questions are how long people remain on their states minimum wage and more data on the fields in which they are working. To gain more conclusive information, the Department of Labor should present a study gathering further data on state minimum wage workers. With additional information, policymakers can craft and advance legislation to address the issue.
- Provide additional funding to the Department of Labor’s Wage and Hour Division.
The Wage and Hour division monitors minimum wage violations and regulations. Proposed increases to minimum wage create an opportunity for greater interest by corporations to attempt to avoid payments in line with new laws and slow adoption. Additional funding and resources for the Wage and Hour Division are necessary to ensure that minimum wages are being enforced.
Conclusion
Low wages and less wealth for Black American households are strongly influenced by low or no state minimum wages. The United States’ history of slavery continues to influence unfair labor practices today. To combat low pay, lawmakers must demolish exemptions and expand coverage to the Fair Labor Standards Act to require that states use the federal minimum wage as a floor to their state minimum wages without exception. Improving the state minimum wages improve the socioeconomic status and opportunity of Black people through expanding access to wealth, health, education and overall equity. Black workers, advocates and communities alike, need policy change as states below the standard wage set a standard of inequity.
References
A Guide to the History of Slavery in Maryland. (n.d.). Maryland State Archives. https://msa.maryland.gov/msa/intromsa/pdf/slavery_pamphlet.pdf
Acs, G & Lopreset, P. (2009, February) Job Differences by Race and Ethnicity in the Low-Skill Job Market. The Urban Institute. https://www.urban.org/sites/default/files/publication/30146/411841-Job-Differences-by-Race-and-Ethnicity-in-the-Low-Skill-Job-Market.PDF
Anderson, T., Coffey, A., Daly, H., Hahn, H., Maag, E. & Werner, K. (2022, Jan. 11). Balancing at the Edge of a Cliff. The Urban Institute. https://www.urban.org/research/publication/balancing-edge-cliff
Ager, P., Boustan, L.P. & Eriksson, K. (2019). National Bureau of Economic Research. https://www.nber.org/system/files/working_papers/w25700/w25700.pdf?utm_campaign=PANTHEON_STRIPPED&%3Butm_medium=PANTHEON_STRIPPED&%3Butm_source=PANTHEON_STRIPPED
Bhutta, N., Chang, A., Dettling, L., Hsu, J. & Hewitt, J. (2020). Disparities in Wealth by Race and Ethnicity in the 2019 Survey of Consumer Finances. Board of Governors of the Federal Reserve System. https://www.federalreserve.gov/econres/notes/feds-notes/disparities-in-wealth-by-race-and-ethnicity-in-the-2019-survey-of-consumer-finances-20200928.htm
Brittanica. (2019, May 9). Should the Federal Minimum Wage be Increased. Procon.org. https://minimum-wage.procon.org/
Brones, A. (2018, May 15). Food apartheid: the root of the problem with America’s groceries. The Guardian. https://www.theguardian.com/society/2018/may/15/food-apartheid-food-deserts-racism-inequality-america-karen-washington-interview
Cengiz, D., Dube, A., Lindner, A., Zipperer., B. (2019, August). The Effect of Minimum Wages on Low-Wage Jobs. The Quarterly Journal of Economics 134.3.https://doi.org/10.1093/qje/qjz014
Changes in Basic Minimum Wages in Non-Farm Employment Under State Law: Selected Years 1968 to 2021. (n.d.) United States Department of Labor. https://www.dol.gov/agencies/whd/state/minimum-wage/history
Characteristics of minimum wage workers, 2020. (2021, February). Bureau of Labor Statistics. https://www.bls.gov/opub/reports/minimum-wage/2020/pdf/home.pdf
Collins, W. & Wanamaker, W. (2021). AFRICAN AMERICAN INTERGENERATIONAL ECONOMIC MOBILITY SINCE 1880. National Bureau of Economic Research. https://www.nber.org/system/files/working_papers/w23395/w23395.pdf
Cooper, D. (2015, May). Raising the Minimum Wage to $12 by 2020 Would Lift Wages for 35 Million American Workers. Economic Policy Institute. https://www.epi.org/publication/raising-the-minimum-wage-to-12-by-2020-would-lift-wages-for-35-million-american-workers/
Cooper, D., Mohkiber, Z., & Zipperer, B. (2021, March 6). Raising the federal minimum wage to $15 by 2025 would lift the pay of 32 million workers. Economic Policy Institute. https://www.epi.org/publication/raising-the-federal-minimum-wage-to-15-by-2025-would-lift-the-pay-of-32-million-workers/
Consolidated Minimum Wage Table. (Revised Jan.1, 2022- Retrieved February 3, 2022). Department of Labor. https://www.dol.gov/agencies/whd/mw-consolidated
CPI Inflation Calculator. (n.d.). United States Bureau of Labor Statistics. https://data.bls.gov/cgi-bin/cpicalc.pl?cost1=7.25&year1=200901&year2=202202
Department of Labor. (n.d.) Questions and Answers About the Minimum Wage. United States Department of Labor. https://www.dol.gov/agencies/whd/minimum-wage/faq#:~:text=Various%20minimum%20wage%20exceptions%20apply,tipped%20employees%20and%20student%2Dlearners
Desilver, D. (2021, March 12). When it Comes to Raising the Minimum Wage, Most of the Action is in Cities and States, Not Congress. Pew Research Center. https://www.pewresearch.org/fact-tank/2021/03/12/when-it-comes-to-raising-the-minimum-wage-most-of-the-action-is-in-cities-and-states-not-congress/
Economic History Association. (n.d.). Slavery in the United States. EH.net.
Emancipation Proclamation. (2022, January 28). National Archives. https://www.archives.gov/exhibits/featured-documents/emancipation-proclamation#:~:text=President%20Abraham%20Lincoln%20issued%20the,and%20henceforward%20shall%20be%20free.%22
Fact Sheet- Raising the Minimum Wage, Good for Workers: Businesses and the Economy. (n.d.) Committee on Education and the Workforce Democrats. United States Congress. https://edlabor.house.gov/imo/media/doc/FactSheet-RaisingTheMinimumWageIsGoodForWorkers,Businesses,andTheEconomy-FINAL.pdf
Fair Labor Standards Act of 1938.29 U.S.C. June 25, 1938, ch. 676, §1, 52 Stat. 1060.(1938 Updated 2007). https://uscode.house.gov/view.xhtml?path=/prelim@title29/chapter8&edition=prelim
Franklin Roosevelt, Public Papers and Address, Vol. VII (New York, Random House, 1937), p.392.Gould, E. & Kandra, J. (2021, February). Wages grew in 2020 because the bottom fell out of the low-wage labor market. Economic Policy Institute. https://www.epi.org/publication/state-of-working-america-wages-in-2020/
Gould, E.& Wilson, V. (2020). Black workers face two of the most lethal preexisting conditions for coronavirus—racism and economic inequality. Economic Policy Institute. https://www.epi.org/publication/black-workers-covid/
The Great Migration (1910-1970). (n.d.). National Archives. https://www.archives.gov/research/african-americans/migrations/great-migration
Harris, C. (1993). Whiteness as Property. Harvard Law Review. https://harvardlawreview.org/1993/06/whiteness-as-property/
History of the Changes to the Minimum Wage. (n.d.) United States Department of Labor. https://www.dol.gov/agencies/whd/minimum-wage/history
History of Federal Minimum Wage Rates Under the Fair Labor Standards Act, 1938 – 2009. (n.d.) United States Department of Labor. https://www.dol.gov/agencies/whd/minimum-wage/history/chart
House Committee on Education and Labor. “Fact Sheet- Raising the Minimum Wage, Good for Workers: Businesses and the Economy.” (n.d.). House Committee on Education and Labor formerly the Committee on Education and the Workforce Democrats. United States Congress. https://edlabor.house.gov/imo/media/doc/FactSheet-RaisingTheMinimumWageIsGoodForWorkers,Businesses,andTheEconomy-FINAL.pdf
Jones, J., Schmitt, J. & Wilson, V. (2018, February 26) “50 Years After the Kerner Commission.” Economic Policy Institute. https://www.epi.org/publication/50-years-after-the-kerner-commission/
Kline, P., Rose, E. & Walters, C. (Revised 2022, February). Systemic Discrimination Among Large U.S. Employers. National Bureau of Economic Research. https://www.nber.org/papers/w29053
Maciag, M. (2014). Minimum Wage Workers by State. https://www.governing.com/archive/minimum-wage-workers-by-state-statistics-2013-totals.html
Majority of African Americans Live in 10 States; New York City and Chicago Are Cities with Largest Black Populations. (Last revised 2016, May 16). United States Census Bureau.https://www.census.gov/newsroom/releases/archives/census_2000/cb01cn176.html.
Median Household Income and Percent Change by Selected Characteristics. (2020). United States Census Bureau. https://www.census.gov/content/dam/Census/library/visualizations/2020/demo/p60-270/figure1.pdf
Merriam Webster. (n.d.). Differently-Abled. https://www.merriam-webster.com/dictionary/differently%20abled#:~:text=Definition%20of%20differently%20abled,%2C%20acting%20and%20public%20speaking.%E2%80%94
Minimum Wage. (n.d. retrieved February 3, 2022). Department of Labor. https://www.dol.gov/agencies/whd/minimum-wage#:~:text=The%20federal%20minimum%20wage%20provisions,employers%20must%20comply%20with%20both
Morris, K. (2021, March 6). Georgia’s Proposed Voting Restrictions Will Harm Black Voters Most. https://www.brennancenter.org/our-work/research-reports/georgias-proposed- voting-restrictions-will-harm-black-voters-most
Mullen, Lincoln. (2014, May 15). Smithsonian Magazine. https://www.smithsonianmag.com/history/maps-reveal-slavery-expanded-across-united-states-180951452/
Myers, Barton. (Last modified 2020, September 30). Sherman’s Field Order No. 15. New Georgia Encyclopedia. https://www.georgiaencyclopedia.org/articles/history-archaeology/shermans-field-order-no-15/
National Conference of State Legislatures. (2022, March 9). State Minimum Wages. National Conference of State Legislatures. https://www.ncsl.org/research/labor-and-employment/state-minimum-wage-chart.aspx
New England Colonies’ Use of Slave Labor. (2020, January 13) National Geographic. https://www.nationalgeographic.org/article/new-england-colonies-use-slaves/
Out of Reach 2021. (2021) National Low Income Housing Coalition. https://nlihc.org/sites/default/files/oor/2021/Out-of-Reach_2021.pdf
Packman, H. (2020, June 19). Juneteenth and the Broken Promise of “40 Acres and a Mule.” National Farmers Union. https://nfu.org/2020/06/19/juneteenth-and-the-broken-promise-of-40-acres-and-a-mule/#:~:text=The%20long%2Dterm%20financial%20implications,be%20worth%20%24640% 20billion%20today
Poverty Thresholds. (2021). United States Census Bureau. https://www.census.gov/data/tables/time-series/demo/income-poverty/historical-poverty-thresholds.html
Quarterly Residential Vacancies and Homeownership, First Quarter 2021. (2021, April 27). U.S. Census Bureau. https://www.census.gov/housing/hvs/files/currenthvspress.pdf.
Ray, R., Perry, A., Harshbarger, D., Elizondo, S. & Gibbons, A. (2021, Sept. 1) “Homeownership, Racial Segregation, and Policy Solutions to Racial Wealth Equity.” Brookings Institution. https://www.brookings.edu/essay/homeownership-racial-segregation-and-policies-for-racial-wealth-equity/
Reinhardt, S. (2019, June 1). Delivering on the Dietary Guidelines: How Stronger Nutrition Policy Can Cut Healthcare Costs and Save Lives. Union of Concerned Scientists. https://www.jstor.org/stable/resrep24101
Selected Statistics on Slavery in the United States. (n.d.). Weber State University.
https://faculty.weber.edu/kmackay/selected_statistics_on_slavery_i.htm
Slave Population of the United States. (n.d.). United States Census Bureau. https://www2.census.gov/library/publications/decennial/1850/1850c/1850c-04.pdf
State Minimum Wage Laws. (Updated January 1, 2022- Retrieved February 3, 2022). Department of Labor. https://www.dol.gov/agencies/whd/minimum-wage/state
Tamir, C. (2021, March 5). “The Growing Diversity of Black America.” Pew Research. https://www.pewresearch.org/social-trends/2021/03/25/the-growing-diversity-of-black-america/
United Negro College Fund. (n.d.) HBCU’s make America strong: The positive economic impact of historically Black colleges and universities. https://cdn.uncf.org/wp-content/uploads/HBCU_Consumer_Brochure_FINAL_APPROVED.pdf
United States Department of Housing and Urban Development. (2021). Estimated Median Family Incomes for Fiscal Year (FY) 2021. HUDuser.gov. https://www.huduser.gov/portal/datasets/il/il21/Medians2021.pdf
Usual Weekly Earnings of Wage and Salary Workers Fourth Quarter 2021. (2021). Bureau of Labor Statistics. https://www.bls.gov/news.release/pdf/wkyeng.pdf
Wage and Hour Division. (n.d.). United States Department of Labor. https://www.dol.gov/agencies/whd/about/history.
Waxman, E., Gundersen, C. & Fiol, O. (2021, July). How Far Did SNAP Benefits Fall Short of Covering the Cost of a Meal in 2020. The Urban Institute. https://www.urban.org/sites/default/files/publication/104581/how-far-did-snap-benefits-fall-short-of-covering-the-cost-of-a-meal-in-2020.pdf
Weller, C. (2019). African Americans Face Systematic Obstacles to Getting Good Jobs
Center for American Progress. https://www.americanprogress.org/article/african-americans-face-systematic-obstacles-getting-good-jobs/
Wilson, V. (2020).” Racial disparities in income and poverty remain largely unchanged amid strong income growth in 2019.” Economic Policy Institute. https://www.epi.org/blog/racial-disparities-in-income-and-poverty-remain-largely-unchanged-amid-strong-income-growth-in-2019/
Zipperer.B. (2021, July 22). The Minimum Wage Has Lost 21% of its Value Since Congress Last Raised the Wage.” Economic Policy Institute. https://www.epi.org/blog/the-minimum-wage-has-lost-21-of-its-value-since-congress-last-raised-the-wage/
2021 Poverty Guidelines. (2021). Office of the Assistant Secretary for Planning and Evaluation. United States Department of Health and Human Services. https://aspe.hhs.gov/topics/poverty-economic-mobility/poverty-guidelines/prior-hhs-poverty-guidelines-federal-register-references/2021-poverty-guidelines
[1] States with economies dependent on slave labor by the 1850’s. These states had more than 100,000 enslaved Africans by this period.
[2] The Great Migration was a period between 1910-1970 where formerly enslaved Black people moved from southern states to states in the American North, West, and Midwest. https://www.archives.gov/research/african-americans/migrations/great-migration
[3] Maryland, another key place where Black people live, was not one of the main Great Migration states, but was still a minor Great Migration state as a place where Black families migrated during the early to mid-1900’s (National Archives, n.d.).
[4] Food apartheid is the term used to describe the social inequalities that lead to a lack of grocery stores and access to healthy food in certain communities (Brones, 2018).
[5] This is based on a 2,080-hour work year.